How to Calculate Degrees of Freedom: A Comprehensive Guide for 2025
Understanding how to calculate **degrees of freedom** is crucial in various statistical analyses, whether you’re performing a t-test, ANOVA, or regression analysis. This guide will help you navigate through the complexity of calculating degrees of freedom and its implications in statistical methodologies for the year 2025.
Understanding Degrees of Freedom in Statistics
The concept of **degrees of freedom** refers to the number of independent values or variables that can vary in a statistical calculation. It’s essential in many statistical tests, as it affects the results significantly. In simple terms, degrees of freedom is determined by the number of observations in a sample minus the constraints placed on the data. For example, in calculating the sample mean, one constraint is the calculation itself, which adjusts the degrees of freedom in that context. Understanding **statistics degrees of freedom** provides foundational insight into the way data behaves and the reliability of statistical estimates.
Definition of Degrees of Freedom
Degrees of freedom can be defined as the number of independent values in a statistical calculation that contribute to the result. For instance, when calculating the **degrees of freedom for sample size**, if you have 10 observations, then the degrees of freedom would typically be 10 minus the constraints applied (like estimating parameters). Hence, in a dataset without constraints, it simply equals the number of observations. Understanding degrees of freedom helps grasp the variability and precision in data analyses.
Importance of Degrees of Freedom in Statistical Testing
In any statistical test, such as a t-test or ANOVA, the value of degrees of freedom has significant implications. It helps determine the **critical values** from statistical distributions that we compare our obtained statistics against. For example, in a **degrees of freedom in t-test**, knowing the correct degrees of freedom allows researchers to accurately assess whether their findings are statistically significant, thereby directing how they interpret their results in hypothesis testing. If the degrees of freedom are not properly accounted for, the risk of Type I or Type II errors increases.
Calculating Degrees of Freedom: Types and Examples
Calculating degrees of freedom depends on the statistical model and the constraints involved. Common types include degrees of freedom for a one-sample t-test, two-sample t-test, or ANOVA. For example, for a one-sample t-test, the **degrees of freedom formula** is simply \( n – 1 \), where \( n \) is your sample size. In larger tests like ANOVA, the calculation is more complex and requires a breakdown of “between” and “within” groups which separates the variation in data into respective parts. By practicing examples of degrees of freedom calculation for different tests, researchers can harness a stronger statistical intuition.
Degrees of Freedom in Hypothesis Testing
In hypothesis testing, degrees of freedom play a pivotal role. They are essential in determining the appropriate statistical test and interpreting the significance of test results accurately. The calculations can vary widely, which highlights the need for understanding degrees of freedom explained in various situational contexts. Different statistical tests use different approaches to calculate degrees of freedom depending on sample sizes and number of groups under comparison.
Degrees of Freedom in T-test
When conducting a t-test, degrees of freedom are central to computing the t-statistic. For a one-sample t-test, the formula remains simply \( n – 1 \). In a two-sample t-test, degrees of freedom reflect the total number of subjects minus the number of groups being compared: \( (n_1 + n_2 – 2) \), where \( n_1 \) and \( n_2 \) are the sample sizes of each group. The proper calculations ensure that statistical inferences from hypothesis testing are robust and reliable, enhancing the understanding of underlying patterns in the data.
Degrees of Freedom in ANOVA
Analysis of Variance (ANOVA) utilizes a more intricate calculation of degrees of freedom due to the need for separating variations among multiple groups. It generally uses the model \( (k – 1, N – k) \), where \( k \) is the number of groups, and \( N \) depicts the total number of observations. By achieving a clearer picture of how group means diverge, researchers can better identify differences that may hold practical significance. Keeping track of **degrees of freedom in variance analysis** is crucial when interpreting ANOVA results.
Visualizing Degrees of Freedom in Statistical Models
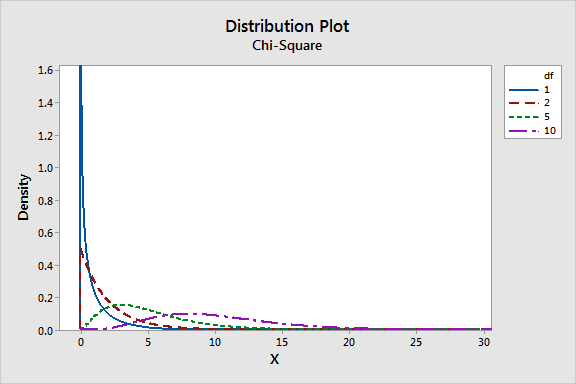
Visualizing degrees of freedom can greatly enhance comprehension of its impact on statistical outcomes. Utilizing plots and graphs can illuminate how varying degrees of freedom affect hypothesis testing results. For instance, a graph showcasing the t-distribution with diverse degrees of freedom will present different shapes, illustrating how degrees of freedom influence tail behaviors, robustness, and coverage probabilities in confidence intervals.
Calculator for Degrees of Freedom in 2025
With technology evolving, numerous calculators can assist in calculating degrees of freedom for different statistical tests. These calculators remove manual complexity and reduce the likelihood of errors in computation. A **degrees of freedom calculator** can simplify the process and expedite data analysis, especially when dealing with complex datasets or numerous statistical comparisons. Accessibility to such tools means that researchers can focus more on data interpretation than the arithmetic involved.
Degrees of Freedom in Regression Analysis
In regression analysis, the calculation of degrees of freedom differs based on whether you’re using simple or multiple regression. For simple linear regression, it is generally calculated as \( n – 2 \) (one degree for the slope and one for the intercept). In multiple regression, it becomes more complex, as the total degrees of freedom are reduced based on the number of predictors. Understanding **degrees of freedom in regression analysis** is essential for accurate coefficient estimation and hypothesis testing regarding model effectiveness.
Understanding the Impact of Degrees of Freedom
The degrees of freedom impact almost all areas of statistical inference. Lower degrees of freedom can indicate less certainty and variability in the population parameter estimates. Consequently, consequences in hypothesis testing and modeling must consider how well the degrees of freedom correlate with the dataset’s inherent characteristics. Addressing the **impact of degrees of freedom** can lead to more refined interpretations of statistical outputs and decision-making processes based on those analyses.
Advanced Topics in Degrees of Freedom
Exploring advanced topics such as **degrees of freedom in complex models** is continually beneficial. These advanced models could include factorial designs or mixed models where degrees of freedom change with the model specification and data structure. Gaining insights related to analyzing pathways in sophisticated data analyses enriches statistical knowledge and enhances overall analytical approach.
Conclusion
In conclusion, this guide on **how to calculate degrees of freedom** covers foundational definitions, calculations across various statistical tests, and implications in analysis. Understanding degrees of freedom elevates one’s capacity for sound statistical reasoning and enables robust interpretations in research and data analytics as we venture into 2025. Grasping these concepts reinforces essential statistical thinking skills necessary across varied disciplines in both academic and practical fields.
FAQ
1. What is the definition of degrees of freedom in statistical analysis?
The **definition of degrees of freedom** is the number of independent values in a statistical calculation that can vary. It’s essential in many statistical tests, influencing the critical value comparisons needed for hypothesis testing and estimation procedures.
2. Why are degrees of freedom significant in ANOVA?
In ANOVA, degrees of freedom help separate variations between groups from within groups. Understanding these values determines how well we can assess mean differences across groups, ultimately guiding sound conclusions based on statistical evidence.
3. How do you determine degrees of freedom for multiple regression?
In multiple regression analysis, the degrees of freedom are determined by the total number of observations minus the number of predictors being estimated. This typically results in the formula \( n – k \), where \( n \) is the number of observations, and \( k \) is the number of parameters estimated.
4. Can degrees of freedom be negative?
No, degrees of freedom cannot be negative. They represent a count of independent values, and a negative value would imply an inconsistency in calculations or assumptions, indicating a need for reevaluation of the model or analysis being conducted.
5. What tools can help in calculating degrees of freedom?
Several statistical software and online tools can assist in calculating degrees of freedom for different tests, including R, SPSS, or specialized **degrees of freedom calculators** available on various educational platforms.
6. What is an example of degrees of freedom calculation in a t-test?
In a simple one-sample t-test with a sample size of 15, the degrees of freedom would be calculated as \( n – 1 = 15 – 1 = 14 \). This signifies the number of independent observations used to estimate population parameters.
7. How do degrees of freedom relate to sample size and confidence intervals?
As sample size increases, the degrees of freedom also increase, translating into narrower confidence intervals due to reduced variability in sample estimators. Thus, larger samples yield more reliable estimates and enhance statistical power in hypothesis testing.