How to Properly Find Cumulative Frequency
Cumulative frequency is a vital concept in statistics that helps summarize data and understand its properties. This practical guide will provide a comprehensive overview of **finding cumulative frequency**, explaining key elements such as the **cumulative frequency table**, distribution, and graphing techniques. By the end, you will have a solid understanding of how to effectively analyze and visualize this statistical data.
Understanding Cumulative Frequency in Statistics
The first step in mastering cumulative frequency is understanding its **definition** and significance. In statistics, **cumulative frequency** refers to the running total of frequencies in a dataset. Essentially, it aggregates the frequencies of the data intervals, allowing for a clearer view of its distribution. For instance, in a frequency table that outlines the number of students who scored within different intervals, once you apply **cumulative frequency**, you get an idea of how many students scored less than a certain threshold.
Cumulative Frequency Formula
The **cumulative frequency formula** serves as the foundation for calculating cumulative frequencies. To find the cumulative frequency for each interval, you simply add the frequency of that interval to the cumulative frequency of the previous interval. For example, if the first interval has a frequency of 5, the next interval has a frequency of 7, the cumulative frequency would be 5 for the first and 12 (5 + 7) for the second. Following this method helps in **calculating cumulative frequency** accurately.
Creating a Cumulative Frequency Table
To illustrate the concept further, let’s look at a practical example of building a **cumulative frequency table**. If we have data showing the number of sales made over various weeks, our table might start by listing these intervals. The second column would include the frequency of sales within those intervals. Continuing from our earlier example, after adding a cumulative frequency column, the table will visually depict the total sales from the first interval all the way to the last, effectively guiding our understanding of cumulative frequency trends.
Cumulative Frequency in Visual Representation
Often, it is beneficial to create a **cumulative frequency graph** or polygon to visualize the cumulative frequencies. The x-axis typically represents the upper boundary of the data intervals while the y-axis reflects the cumulative frequency values. The graph is constructed by plotting points for each interval’s cumulative frequency and connecting them with lines. This **cumulative frequency distribution** not only provides insights into data trends but also allows immediate recognition of key thresholds in the dataset.
Applications and Importance of Cumulative Frequency
Cumulative frequency is integral in various **data analysis** methodologies, reinforcing its importance in not only statistics but also in practical applications such as research and data interpretation. By using cumulative frequencies, researchers can compare totals across varying datasets and qualitative segments. This method allows for identifying significant patterns and trends, which may not be evident from raw data alone.
Cumulative Frequency in Research
Understanding **cumulative frequency in research** is crucial. It is often used in survey analysis where researchers need to ascertain how respondents are distributed across different ranges. For instance, analyzing age groups in a population study could help determine the cumulative percentage of respondents under 30. This aggregates valuable insights pertaining to the overall demographic and can influence decisions significantly.
Practical Uses in Data Analysis
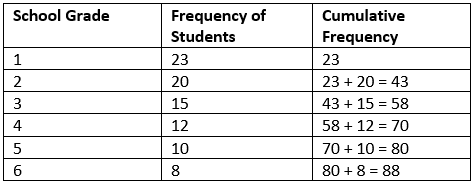
In data analysis, the **cumulative frequency method** allows for numerous applications. For example, visualizing school grades in cumulative form can help teachers identify how many students are passing versus failing. This analytical capability enables not only a clearer picture of performance but also the ability to address educational or organizational needs effectively.
Significance of Cumulative Frequency in Data Representation
The **importance of cumulative frequency** extends to its ability to foster deeper understanding through data representation. Cumulative frequencies clarify relationships within data, making them easier to comprehend and interpret. This aspect of cumulative frequency not only streamlines the understanding of a dataset but also enhances the presentation of findings, especially for statistical reporting.
Calculating Cumulative Frequency Effectively
To ensure accurate calculations when working with cumulative frequency, understanding the **cumulative frequency calculation steps** is vital. This structured process minimizes errors as you calculate, allowing more reliable data representation and audits of results. When you proceed through each step methodically, you maintain the integrity of your analysis.
Steps for Cumulative Frequency Calculation
The first step in **calculating cumulative frequency** is to organize your data in intervals. Next, determine the frequency of each interval, followed by adding these frequencies cumulatively to establish the next value. This process continues until you have covered all intervals. By documenting each frequency as you go, you can maintain a clear and error-free path towards full cumulative frequency computation.
Cumulative Frequency Simplified for Beginners
For those new to statistics, **cumulative frequency simplified** can be approached in small bites. Start with small datasets where the intervals are limited. As you practice and become familiar with defining your **cumulative frequencies**, you can gradually tackle more complex datasets. Utilizing digital tools or software designed for statistics can also streamline this process and provide an additional layer of support.
Analyzing Cumulative Frequency Problems
In the realm of statistics, being proficient in **cumulative frequency problems** is paramount. Take, for instance, the scenario where you have to identify how many students score below a certain mark. By digging into a **cumulative frequency analysis**, it becomes straightforward to derive at a solution without manually counting scores across ranges. This efficiency can prove crucial in time-sensitive environments like examinations or statistical reporting deadlines.
Key Takeaways
- Cumulative frequency helps in summarizing and understanding datasets effectively.
- Creating a cumulative frequency table enables clearer data presentation.
- Cumulative frequency graphs aid in visualizing trends and distributions.
- Utilizing cumulative frequency in research can uncover valuable patterns.
- Applying cumulative frequency methods can enhance accuracy in data analysis.
FAQ
1. What is cumulative frequency in statistics?
**Cumulative frequency in statistics** refers to the total accumulation of frequencies as you progress through the data intervals. This summarization allows one to observe the cumulative total rather than just the isolated frequencies of each category.
2. How can cumulative frequency be represented graphically?
A **cumulative frequency graph** can be constructed where the x-axis represents the intervals and the y-axis shows cumulative frequencies. This graphical representation allows for clear visibility of distributions and trends in the dataset.
3. What is the significance of cumulative frequency in data analysis?
The **significance of cumulative frequency** lies in its ability to reveal patterns and trends in data that raw frequency distributions may not highlight, thus facilitating better statistical inference and decision-making.
4. Can cumulative frequency be used for continuous data?
Yes, **cumulative frequency for continuous data** is effective, as it helps visualize trends and totals within continuous measurements, making it applicable in fields like physics and economics.
5. What are some common problems associated with cumulative frequency?
Common **cumulative frequency problems** include errors in adding frequencies and misinterpreting cumulative totals. Ensuring a thorough understanding of calculation methods is essential to avoid inaccuracies.
6. How do you create a cumulative frequency table?
To create a **cumulative frequency table**, list your data intervals, note their frequency values, and then add up these frequencies progressively to form the cumulative column, which reflects the running totals of frequencies.
7. How does cumulative frequency differ from relative frequency?
**Cumulative frequency** accumulates the count of occurrences across intervals, while **relative frequency** expresses the portion of the total count constituted by each interval, often as a fraction or percentage of the grand total.
For a visual tutorial on creating cumulative frequency tables, visit our associated resources at this link. If you need insights on solving statistical analysis problems, check here.