“`html
Smart Ways to Find the Domain and Range of a Graph in 2025
Understanding Domain and Range in Graphing
Finding the domain and range of a graph is a fundamental concept in mathematics. To elucidate, the domain refers to all possible x-values that can be input into a function, while the range encompasses all possible y-values produced by that function. Determining these values is crucial for analyzing the properties of a graph, as well as understanding how different functions behave across various intervals. In this section, we will explore effective strategies for identifying the domain and range through both visual assessments and mathematical methods.
Graphical Representation of Domain and Range
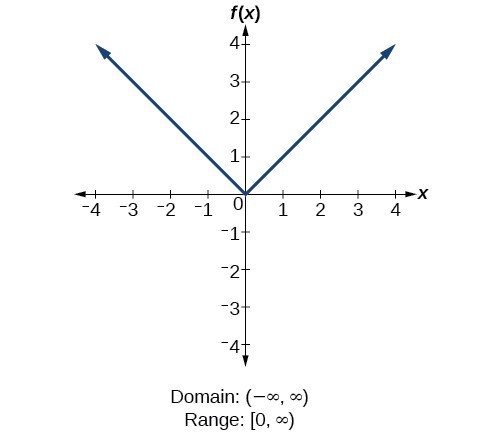
One of the most effective ways to find the domain and range is through graphical representation. A graph visually illustrates relationships between the x-values and y-values, making it easier to see the endpoints and any restrictions. To determine the domain of a function graphically, one should look at the horizontal extent of the graph. If the graph touches or approaches certain endpoints, that’s an indicator of its domain. Conversely, the range can be identified by examining the vertical extent of the graph. Are there any values along the y-axis that the graph does not reach? These gaps or jumps help characterize the range of the function. Always consider the context of the graph—whether it illustrates a continuous function or if it’s comprised of discrete points.
Using Mathematical Notation to Define Domain and Range
Mathematical notation provides a clear and concise way to define the domain and range. For instance, if a function’s domain includes all real numbers, it can be expressed in set notation as: {x | x ∈ ℝ}. Similarly, you may specify intervals, such as [0, ∞), for functions where the x-values start at zero and extend to infinity. The same principles apply for the range; defining where y-values lie can also make life easier in analytical discussions. Techniques like this allow for a detailed representation that is exceedingly useful for functions that are bounded or unbounded. Furthermore, interval notation or inequalities can also represent the domain and range, depending on their characteristics.
Transformations and Their Impact on Domain and Range
Understanding transformations is vital in exploring how a function’s domain and range alter. Transformations include shifting, reflecting, and stretching the graph of a function. For example, consider the function g(x) = f(x – 2) + 3. The transformation right by 2 units will affect all x-values and thus alter the domain by the same shift. Similarly, a vertical shift of +3 affects the y-values, shifting the entire range of the function. It’s imperative for students and professionals alike to grasp how these modifications can impact the properties of a function to facilitate correct identification of domains and ranges during analysis.
Techniques for Determining Domain and Range
Various techniques can be employed to accurately determine the domain and range of functions displayed on a graph. These methods range from graphical approaches to analytical evaluations, catering to various contexts in the solving processes. Here, we will focus on techniques such as the horizontal line test and vertical line test, among others, to reinforce understanding.
Vertical Line Test for Domain Identification
The vertical line test serves as a valuable tool in determining whether each x-value in a function corresponds to one y-value. By visualizing this concept, if a vertical line intersects the graph at multiple points, the graph does not represent a function suitable for discerning domain recognition since it violates the uniqueness of y-values. By ensuring the graph passes the vertical line test, we can confirm its potential characteristics and theorize about its domain based on maximum potential inputs available across the plot.
Horizontal Line Test for Range Evaluation
Conversely, the horizontal line test helps verify if a function can produce a single y-value from multiple x-values. To successfully identify the range of a function, apply this technique: if any horizontal line intersects the plot more than once, it signals that there exist multiple x inputs yielding the same y-value (hence function dilemmas). This is especially pertinent in evaluating quadratic or exponential functions where intersection points can implicitly reveal range based limits and behaviors on y-values.
Using Graphical Techniques to Evaluate Functions
Another effective graphical method is utilizing a plotting approach. By establishing a table of values for a selected function and plotting them against a coordinate plane, it’s straightforward to assess the respective x-values and how they map to y-values. This hands-on exploration aids in recognizing any breaks, asymptotes, or discontinuities that might impact the overall domain and range. By connecting the dots, one can visualize subsequent relationships, thus enhancing the internal grasp and appreciation of result interpretations—all invaluable for analyzing functions in mathematical contexts.
Real-World Applications of Domain and Range
The concepts of domain and range transcend theoretical understanding, as they also possess substantial applications in real-world contexts. The importance of identifying domain and range can be seen within various fields of study and real-life decision-making processes where parameters and limits guide efficient outcomes. In this section, we will discuss identified applications in professional scenarios and how understanding these concepts can lead to better conclusions.
Domain and Range in Engineering
In engineering fields, particularly those focused on structural design, understanding the domain and range is integral for resource management. Recognizing the limitations and available materials relies on the effective analysis of function outputs. For example, when designing various aspects of a bridge or building, engineers need to calculate materials and structural integrity while analyzing weight laws and stress distributions; understanding functions helps maximize safety measures and thresholds within defined variables, ensuring a successful design and execution.
Domain and Range in Economics
Economics also leverages the concepts of domain and range when analyzing supply and demand graphs. In constructing demand curves, the quantity demanded (often represented as a range) varies considerably based on pricing strategies (the domain). Here, knowing the bounds of acceptable price points corresponding to respective outputs of sales provides invaluable insights into consumer behavior. Additionally, these analytical measures guide effective market strategies, facilitating actionable outcomes.
Domain and Range in Digital Analytics
In the domain of digital analytics and data visualization, the interplay of domain and range becomes vital to understanding user behaviors. Analyzing data over a bound of time relative to acquisition strategies allows businesses to assess results against specified benchmarks. By employing various graphing techniques, digital marketers can visually present outcome measures that derive actionable insights from users’ interactions and behavior. By understanding how to navigate these elements across platforms and metrics, marketing accuracy and resource management can better evolve toward efficiency.
Key Takeaways
- Understanding domain and range is crucial for analyzing functions and graphs.
- Graphical representation, mathematical notation, and transformation awareness are effective methods for identifying domain and range.
- Functional tests like the vertical and horizontal line tests reinforce our understanding of the relationships between x-values and y-values.
- Domains and ranges play significant roles in practical applications across various fields, including engineering and economics.
- Graphical techniques with tables and coordinate planes are useful for evaluating function outputs and boundaries.
FAQ
1. How do you find the domain of a function?
To find the domain of a function, identify all possible x-values that can be inputted without violating the function’s rules. This involves examining the function for defined equations, restrictions like square roots (which require non-negative inputs), and asymptotic behavior that may trigger discontinuities. Often, you can express the domain using interval notation, such as [−∞, 0) or any boundaries established by the function’s characteristics.
2. What is the difference between domain and range?
The domain of a function refers to the set of all possible x-values (inputs) that the function can accept, while the range consists of all possible y-values (outputs) produced by those inputs. Understanding the differences between these two concepts helps in proper analysis and helps convey the limits of functions in graphical representations.
3. Can a function have an empty domain or range?
Yes, it is possible for a function to have an empty domain or range. This situation occurs in cases such as undefined or non-existent output values. For instance, a function that seeks to evaluate square roots of negative x-values would yield an empty domain. Similarly, triangles or parametric equations may only cover strict output values or undefined ranges in some contexts.
4. What role do inequalities play in finding domain and range?
Inequalities help define constraints and limitations related to x-values and y-values. For example, if a function’s valid outputs only include non-negative values, this can be denoted as y ≥ 0, thus establishing boundaries for the range. Analyzing the behaviors dictated by inequalities aids in identifying and confirming both domain and range accurately based on the function’s behavior.
5. How can transformations impact the domain and range?
Transformations such as shifts, stretches, and reflections can directly affect the domain and range of functions. For instance, if a function’s graph shifts vertically upward, all corresponding y-values change, thereby adjusting the range. Meanwhile, a horizontal transformation would impact all x-values, ultimately redefining the domain. Understanding these interactions is crucial for accurate function assessments in both theoretical and practical scenarios.
“`